Back-to-Back NBA Games Betting and Fatigue Statistics
Table of Contents
- NBA Schedule Analysis: Finding Betting Edges via Player Fatigue Data
- What Researchers Found About Back-to-Back Performance
- Guards vs Bigs: Which Positions Suffer Most
- The Travel Distance Variable
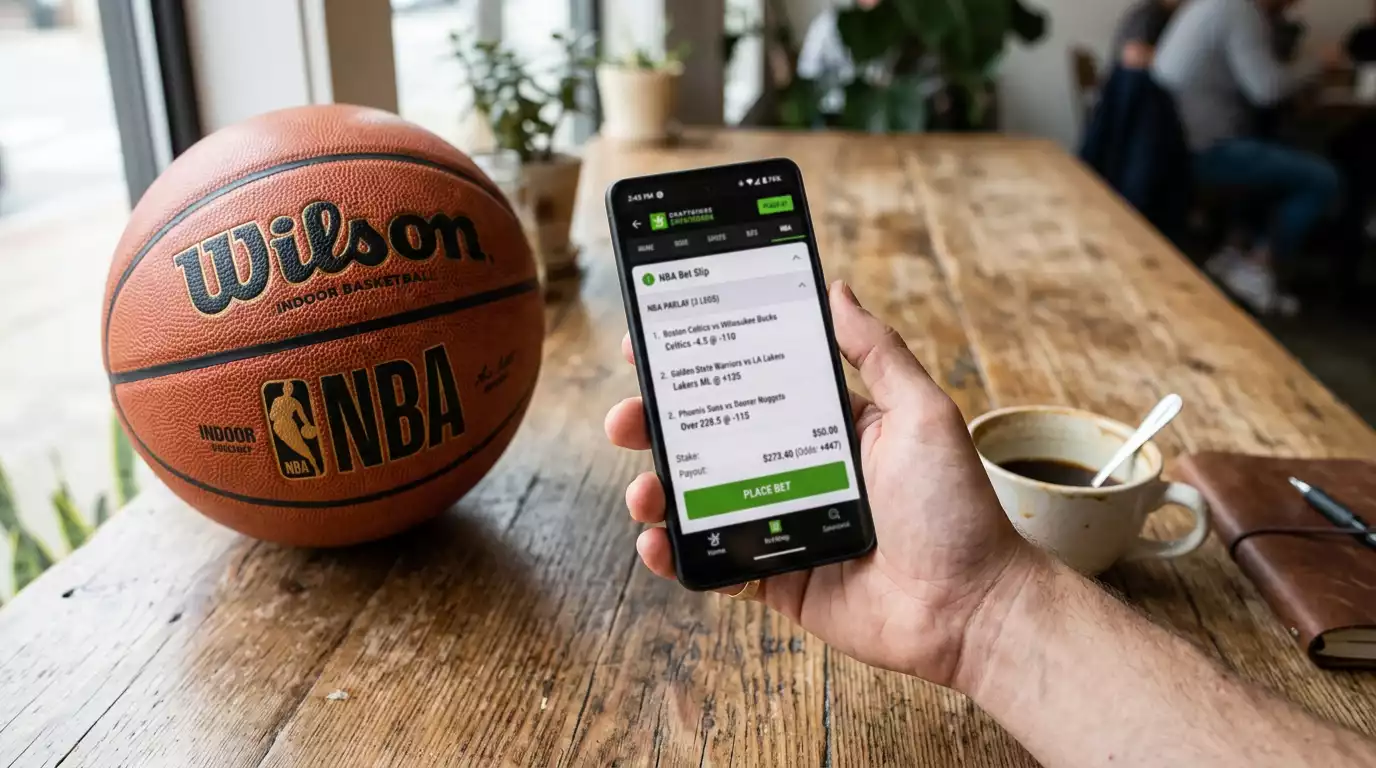
- Load Management and Late Scratches: Betting Implications
- Scheduling Edges Fade When Everyone Has the Data — Move Faster
NBA Schedule Analysis: Finding Betting Edges via Player Fatigue Data
The NBA regular season is a grind that has no equivalent in European sport. Eighty-two games crammed into roughly six months, with teams sometimes playing four games in five nights, crossing three time zones in the process. Guards cover more than five miles per game — and then do it again the next night with less than 24 hours of recovery. That is not a recipe for peak performance. It is a recipe for quantifiable fatigue patterns that the betting market does not always price correctly.
I started tracking back-to-back scheduling effects in 2019 because I noticed something that the stats later confirmed: teams on the second night of a back-to-back were underperforming their season averages in ways that felt too consistent to be random. The data agreed. Over the past decade, second-night teams show measurable declines in shooting accuracy, defensive efficiency, and pace — particularly in the second half. For a bettor willing to build a process around scheduling data, this is one of the most accessible edges in NBA markets.
What follows is the research, the positional breakdowns, and the practical angles. If you are building a broader NBA betting strategy from scratch, scheduling analysis should be one of your foundational pillars.
What Researchers Found About Back-to-Back Performance
Wang et al. analysed 2,295 NBA games across ten seasons and found that 19% of contests were decided in the fourth quarter — entering Q4 with a scoring margin of fewer than ten points. That figure matters for back-to-back analysis because fatigued teams disproportionately fade in the fourth quarter. They can keep pace for three quarters on adrenaline and routine, but the final twelve minutes expose the recovery deficit.
García et al. took a different angle, measuring shooting efficiency across quarters and documenting a decline from Q1 to Q4 with an effect size of -1.27. That fatigue-driven accuracy drop is a baseline phenomenon — it happens in every game. On the second night of a back-to-back, the starting point is already lower. Players begin the game with depleted glycogen stores and accumulated micro-damage from the previous night. The shooting decline does not start in Q4; it starts in Q1 and compounds from there.
The practical implication for bettors is not that back-to-back teams always lose — they do not. The record is closer to 45-55 against rest-advantaged opponents over large samples. The implication is that specific performance metrics (field-goal percentage, defensive rating, rebounding rate) degrade in predictable ways, and those degradations affect totals and props more reliably than moneylines. A team can win ugly on a back-to-back. It is far harder to win while also covering a seven-point spread and having its star guard hit 25-plus points.
Guards vs Bigs: Which Positions Suffer Most
Not all positions are affected equally by back-to-back scheduling. The data consistently shows that guards — particularly primary ball-handlers — suffer the most measurable fatigue effects. Guards cover more than five miles per game, handle the ball on nearly every offensive possession, and expend significant energy navigating screens and chasing opposing guards on defence. Their workload is the highest in the sport by distance and intensity metrics.
On the second night of a back-to-back, guard performance drops across multiple categories: points, assists, and field-goal percentage all show statistically significant declines compared to rest-day games. The assist numbers are particularly telling because assists require both physical execution (the pass itself) and cognitive sharpness (reading the defence, timing the delivery). Fatigue degrades both.
Centres and power forwards show smaller but still measurable declines, primarily in rebounding rate and rim protection. The physical demands on bigs are different — more stationary, more contact-based — and the recovery profile appears slightly more resilient to compressed scheduling. If you are betting player props on a back-to-back night, guard props carry more downside risk than big-man props. That asymmetry is actionable.
The Travel Distance Variable
A back-to-back where both games are at home is a completely different proposition from a back-to-back that involves a cross-country flight. A team playing in New York on Friday and Boston on Saturday faces a 90-minute shuttle flight and a one-hour time difference. A team playing in Portland on Friday and Miami on Saturday faces a five-and-a-half-hour flight across three time zones, arriving at 3 a.m. Eastern for a game that tips off eighteen hours later.
The NBA schedule includes both scenarios, and the betting market sometimes treats them identically. It should not. Travel-heavy back-to-backs produce larger performance degradations than home-home or short-hop sequences. The sleep disruption from late-night flights and time-zone shifts compounds the physical fatigue, and the effect is most visible in first-quarter shooting numbers — the period when circadian misalignment hits hardest.
I maintain a simple spreadsheet that flags every back-to-back sequence by travel distance: short (under 500 miles), medium (500-1500 miles), and long (over 1500 miles). The long-distance back-to-backs are where the fatigue effect is strongest and where the betting market most often underadjusts. It takes five minutes per week to update the schedule, and it has been one of my most consistent information edges over the past four seasons.
Load Management and Late Scratches: Betting Implications
The other side of the back-to-back equation is load management — the practice of resting star players on the second night to preserve them for more important games later in the schedule. The NBA has implemented rules requiring teams to report rest decisions, but the announcements often come late, sometimes within an hour of tip-off.
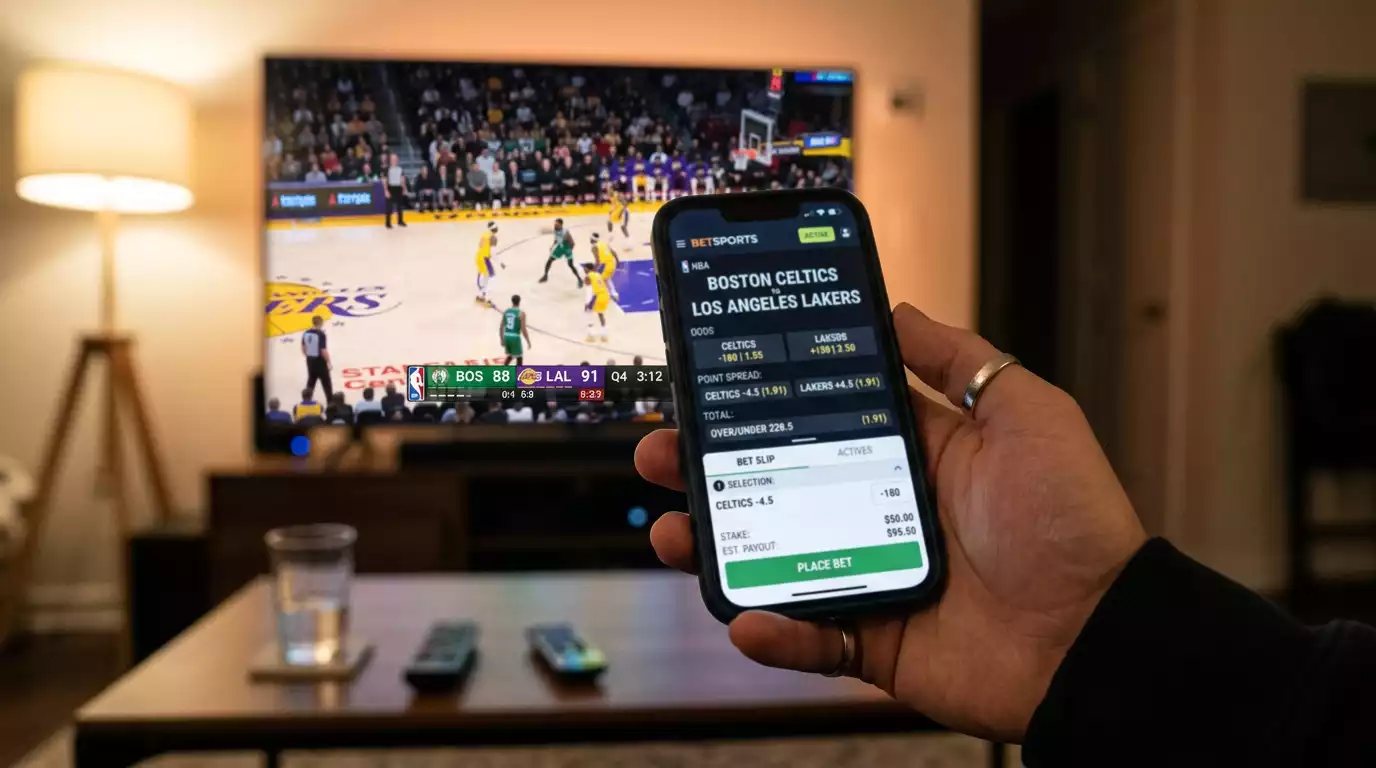
For bettors, a late scratch changes everything. A line that was set with a star player in the lineup suddenly reflects a significantly weaker roster, and the odds adjust rapidly. If you are planning to bet a back-to-back game, monitor injury reports obsessively in the hours before tip-off. The NBA’s official injury report, updated by 5:00 p.m. Eastern on game days, is the primary source — but the “probable” tag on a back-to-back night carries less certainty than it does on a rest-day game.
Some bettors avoid back-to-back games entirely because of load-management uncertainty. I take the opposite approach. The uncertainty itself creates inefficiency. If you have done the schedule work and the injury monitoring, you can act on line movements before the rest of the market catches up. The five-minute window between a late scratch being announced and the odds fully adjusting is where sharper bettors make their living.
Scheduling Edges Fade When Everyone Has the Data — Move Faster
Back-to-back scheduling analysis is not a secret. The data is publicly available, the research has been published, and the sharper sportsbooks have built it into their models. The edge does not come from knowing that fatigue exists. It comes from knowing which specific games, positions, and travel sequences produce the largest deviations — and acting before the line catches up. Build the spreadsheet. Track the flights. Watch the injury wire. The schedule does half the work for you.
Do NBA teams always lose the second game of a back-to-back?
No. Over large samples, teams on the second night of a back-to-back win roughly 45% of those games — not a dramatic loss rate, and not enough to build a blind betting system around. The edge lies in specific metrics rather than outcomes: shooting efficiency, defensive rating, and rebounding rate decline more reliably than win probability. Totals and player props tend to be more affected than moneyline results.
Where can I check the NBA schedule for upcoming back-to-backs?
The official NBA website publishes the full season schedule, which you can filter by team to identify back-to-back sequences. Third-party sites also compile back-to-back schedules with travel distance data. I recommend building a simple spreadsheet that flags each team’s back-to-back games by travel distance — short, medium, and long — to identify the highest-impact fatigue spots throughout the season.
Published by the nba Sports bet team.